The question
When BTC moves, the major exchanges never quote exactly the same price. The popular story says those gaps are opportunities. The honest question is narrower: once you strip out the parts of a gap that are structural — stablecoin drift, trading costs, stale quotes — is anything genuinely exploitable left? Where the answer is no, is there still real structure worth measuring — and does that structure hold up when you test it again in other periods, not just the week you first looked at?
Data
Public one-minute market data for BTC. The core efficiency-and-convergence result rests on Binance and Coinbase — the two venues with deep, freely available one-minute history — measured across six independent seven-day windows spanning January to August 2026 (roughly 10,000 aligned minutes each). The windows were fixed in advance by a mechanical rule (42-day steps, so each sits 35 days clear of the next), before any window was analysed, so none was chosen to fit a result. Lead–lag is measured separately, on live tick data, across all three venues (Binance, Coinbase, Kraken) — a fresh live reading, not a historical test, because tick-level history isn’t available on the free feeds. No private or proprietary feeds; every figure is our own derived analysis, not redistributed raw data.
Method
Binance quotes in USDT while Coinbase and Kraken quote in US dollars, so part of any raw “gap” is just USDT drifting off its peg. We de-margin first — convert every venue into real dollars using the live USDT/USD rate, so the comparison isn’t distorted by the stablecoin’s own price. We then draw an explicit cost band (retail, mid and institutional fee tiers), and test any claimed convergence against an increment-shuffle surrogate — a series with its mean-reversion destroyed but its step sizes kept — with every parameter fixed in advance so nothing is tuned to the result. Because a minute where a venue simply reprints its previous price could fake convergence, we also mask those low-information minutes (zero-volume or unchanged-close) and re-run the test, so a positive result has to survive with them removed. Separately, on live ticks, we measure lead–lag with the Hayashi–Yoshida estimator — the correct tool for asynchronous ticks — across all three venues.
Findings
Efficiency — replicated. After de-margining, the Binance–Coinbase gap averaged about one basis point — roughly one hundredth of one percent — in every window. Against realistic costs it cleared the retail and mid-tier bands in essentially zero of ~10,000 minutes across all six windows; the most generous institutional band was touched only rarely and never in bursts (between 0 and 38 isolated minutes per window, at most about 0.4%). There is no cross-exchange free lunch in liquid BTC spot, and that holds in every period tested.
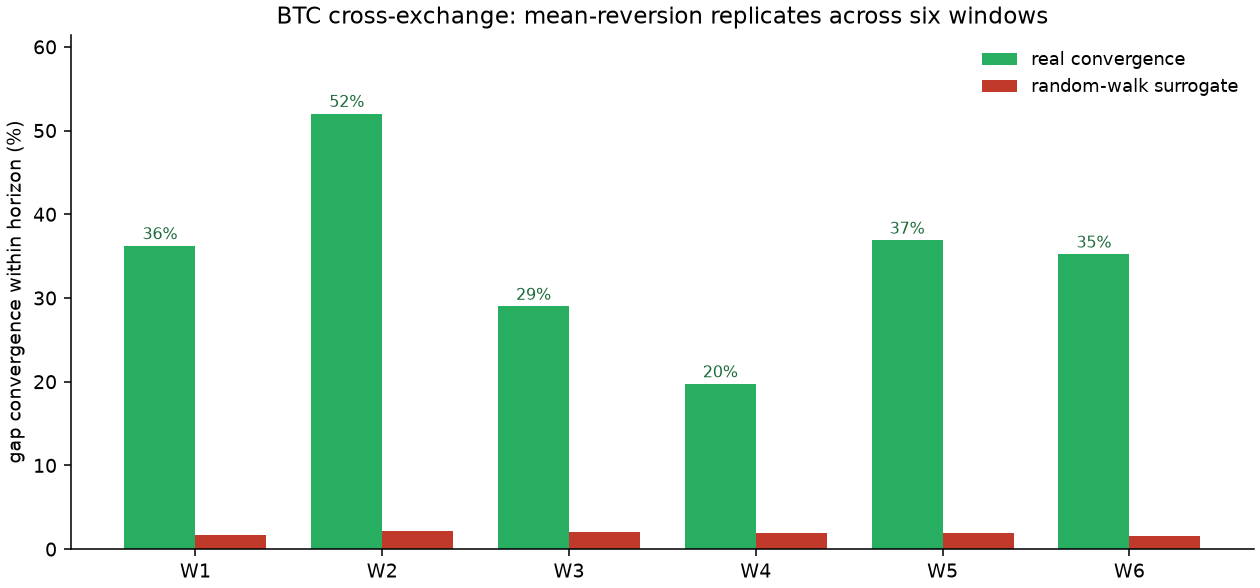
Cointegration — replicated. Efficiency is not randomness. Tested against the surrogate, that ~1 bp gap mean-reverts far more than chance in all six windows — real convergence between roughly 20% and 52% depending on the period, versus a random-walk surrogate stuck near 2% every time (some twenty to fifty standard deviations away from chance). The window overlapping our original study reproduced its published figure almost exactly (~36%), and the effect survived the low-information-minute mask in every window. The venues are cointegrated: a real arbitrage and market-making force pulls them back together within minutes, at a scale far below trading costs — and it is a stable feature across eight months, not an artifact of one week.
Lead–lag — re-confirmed live, not replicated. On fresh live ticks, all three venues move together: the measured lead between any pair sits at the estimator’s resolution floor (a quarter to half a second, with Binance marginally first, as you’d expect from the deepest venue) — no economically meaningful lead. This is a live re-confirmation only; unlike the efficiency and convergence results, it is not tested across historical windows, because free tick-level history isn’t available on every venue.
What this means
The honest read is a precise one: most of the raw cross-venue gap is a structural stablecoin basis, and separating it out is what keeps an analysis from overstating an edge. What remains is a real binding force that is provably too small to trade — and, tested again across six independent windows over eight months, it is a genuine, recurring feature rather than a one-week coincidence. A structure that reliably reappears and is reliably untradable: that separation, measured correctly and declared untradable honestly, is the point — not a promise of profit.